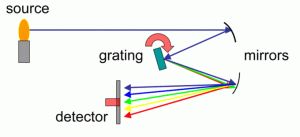

A spectrometer is a measuring device that collects light waves. It uses these light waves to determine the material that emitted the energy, or to create a frequency spectrum. Astronomers make the most frequent use of spectrometers to determine the makeup of stars or other celestial bodies. When objects are hot enough, they emit visible light at a given point or points on the electromagnetic spectrum. Spectrometers split the incoming light wave into its component colors. Using this, they can determine what material created the light.
Over the past 20 years, miniature fiber optic spectrometers have evolved from a novelty to the spectrometer of choice for many modern spectroscopists. People are realizing the advanced utility and flexibility provided by their small size and compatibility with a plethora of sampling accessories.
The basic function of a spectrometer is to take in light, break it into its spectral components, digitize the signal as a function of wavelength, and read it out and display it through a computer. The first step in this process is to direct light through a fiber optic cable into the spectrometer through a narrow aperture known as an entrance slit. The slit vignettes the light as it enters the spectrometer. In most spectrometers, the divergent light is then collimated by a concave mirror and directed onto a grating. The grating then disperses the spectral components of the light at slightly varying angles, which is then focused by a second concave mirror and imaged onto the detector. Alternatively, a concave holographic grating can be used to perform all three of these functions simultaneously. This alternative has various advantages and disadvantages, which will be discussed in more detail later on.
Once the light is imaged onto the detector the photons are then converted into electrons which are digitized and read out through a USB (or serial port) to a computer. The software then interpolates the signal based on the number of pixels in the detector and the linear dispersion of the diffraction grating to create a calibration that enables the data to be plotted as a function of wavelength over the given spectral range. This data can then be used and manipulated for countless spectroscopic applications, some of which will be discussed here later on.